Exhibit 99.2
NASDAQ: SNOA SONOMA PHARMACEUTICALS THIRD QUARTER FY2018 RESULTS February 7, 2018
NASDAQ: SNOA Page Agenda 2 Welcome / Introduction December 31, 2017 Highlights Financial Review Q+A Jim Schutz Jim Schutz Bob Miller
NASDAQ: SNOA Page Forward - Looking Statement Except for historical information herein, matters set forth in this presentation are forward - looking within the meaning of the “safe harbor” provisions of the Private Securities Litigation Reform Act of 1995, including statements about the commercial and technology progress and future financial performance of Sonoma Pharmaceuticals, Inc. and its subsidiaries (the “Company”). These forward - looking statements are identified by the use of words such as “believe,” “achieve,” and “strive,” among others. Forward - looking statements in this press release are subject to certain risks and uncertainties inherent in the Company’s business that could cause actual results to vary, including such risks that regulatory clinical and guideline developments may change, scientific data may not be sufficient to meet regulatory standards or receipt of required regulatory clearances or approvals, clinical results may not be replicated in actual patient settings, protection offered by the Company’s patents and patent applications may be challenged, invalidated or circumvented by its competitors, the available market for the Company’s products will not be as large as expected, the Company’s products will not be able to penetrate one or more targeted markets, revenues will not be sufficient to fund further development and clinical studies, as well as uncertainties relative to varying product formulations and a multitude of diverse regulatory and marketing requirements in different countries and municipalities, and other risks detailed from time to time in the Company’s filings with the Securities and Exchange Commission. The Company disclaims any obligation to update these forward - looking statements, except as required by law. 3
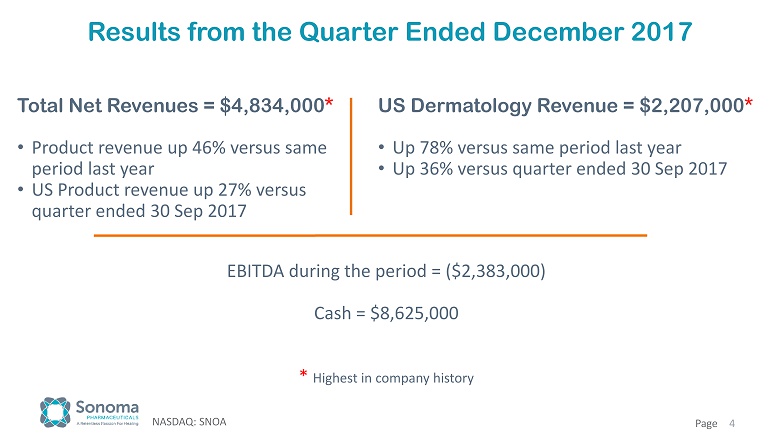
NASDAQ: SNOA Page Results from the Quarter Ended December 2017 Total Net Revenues = $4,834,000 * • Product revenue up 46% versus same period last year • US Product revenue up 27% versus quarter ended 30 Sep 2017 4 US Dermatology Revenue = $2,207,000 * • Up 78% versus same period last year • Up 36% versus quarter ended 30 Sep 2017 EBITDA during the period = ($2,383,000) Cash = $8,625,000 * Highest in company history
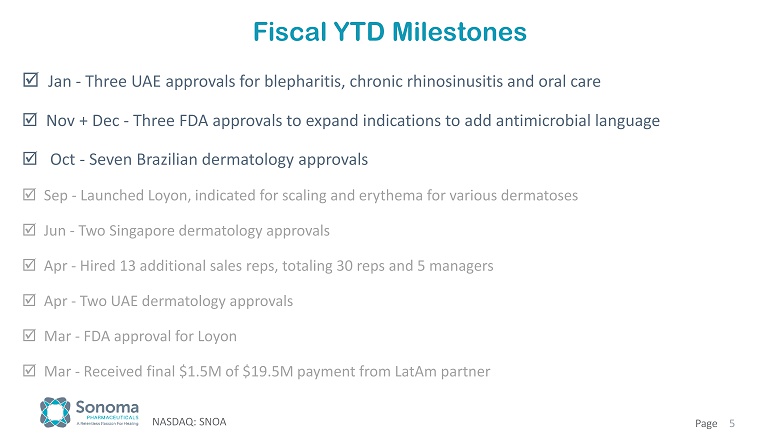
NASDAQ: SNOA Page Fiscal YTD Milestones Jan - Three UAE approvals for blepharitis , chronic rhinosinusitis and oral care Nov + Dec - Three FDA approvals to expand indications to add antimicrobial language Oct - Seven Brazilian dermatology approvals Sep - Launched Loyon, indicated for scaling and erythema for various dermatoses Jun - Two Singapore dermatology approvals Apr - Hired 13 additional sales reps, totaling 30 reps and 5 managers Apr - Two UAE dermatology approvals Mar - FDA approval for Loyon Mar - Received final $1.5M of $19.5M payment from LatAm partner 5
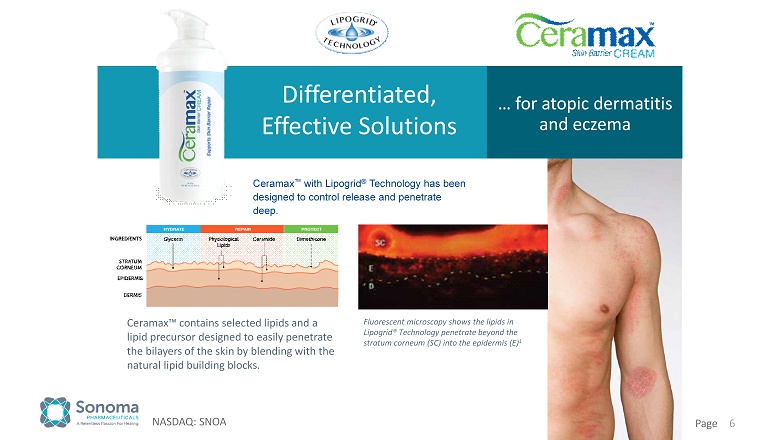
NASDAQ: SNOA Page 6 Differentiated, Effective Solutions … for atopic dermatitis and eczema Ceramax ™ with Lipogrid ® Technology has been designed to control release and penetrate deep. Fluorescent microscopy shows the lipids in Lipogrid® Technology penetrate beyond the stratum corneum (SC) into the epidermis (E) 1 Ceramax™ contains selected lipids and a lipid precursor designed to easily penetrate the bilayers of the skin by blending with the natural lipid building blocks.
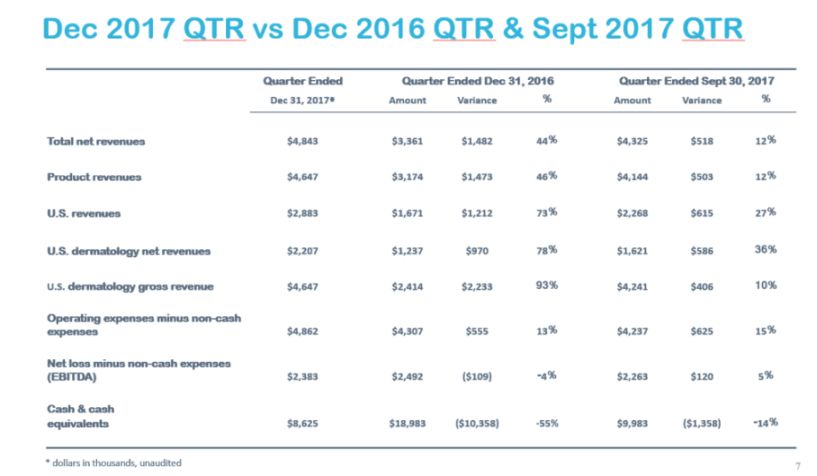
Dec 2017 QTR vs Dec 2016 QTR & Sept 2017 QTR 7 Quarter Ended Quarter Ended Dec 31 , 2016 Quarter Ended Sept 30, 2017 Dec 31, 2017 œ Amount Variance ¸ Amount Variance ¸ Total net revenues $4,843 $3,361 $1,482 44 ¸ $4,325 $518 12 ¸ Product revenues $4,647 $3,174 $1,473 46 ¸ $4,144 $503 12 ¸ U.S. revenues $2,883 $1,671 $1,212 73 ¸ $2,268 $615 27 ¸ U.S. dermatology net revenues $2,207 $1,237 $970 78 ¸ $1,621 $586 ®± ¸ U.S. dermatology gross revenue $4,647 $2,414 $2,233 ´®¸ $4,241 $406 ¬«¸ Operating expenses minus non - cash expenses $4,862 $4,307 $555 13 ¸ $4,237 $625 15 ¸ Net loss minus non - cash expenses (EBITDA) $2,383 $2,492 ($109) § 4 ¸ $2,263 $120 5 ¸ Cash & cash equivalents $8,625 $18,983 ($10,358) - 55% $9,983 ($1,358) § 14 ¸ * dollars in thousands, unaudited
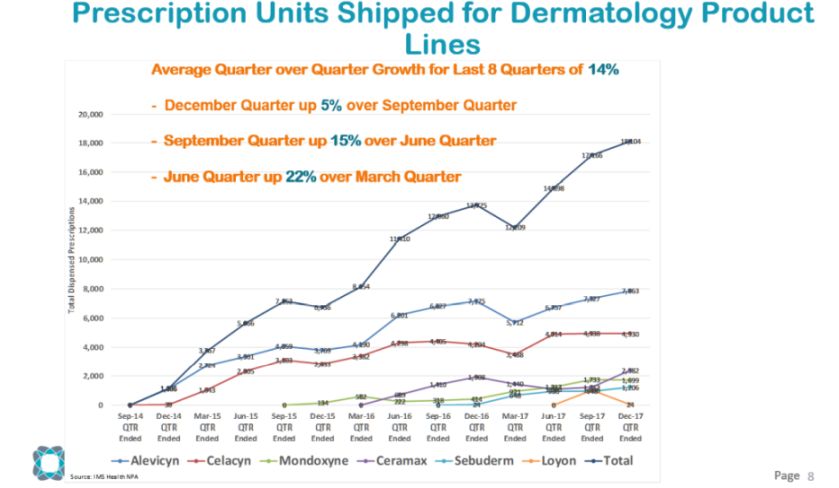
NASDAQ: SNOA Page 8 Prescription Units Shipped for Dermatology Product Lines 0 1,106 2,724 3,361 4,059 3,769 4,190 6,201 6,827 7,175 5,712 6,757 7,327 7,863 0 39 1,043 2,305 3,103 2,833 3,382 4,298 4,405 4,204 3,488 4,914 4,938 4,930 0 134 582 222 318 414 921 1,217 1,733 1,699 0 689 1,410 1,908 1,440 1,080 1,212 2,382 0 24 648 930 948 1,206 0 1,008 24 0 1,145 3,767 5,666 7,162 6,736 8,154 11,410 12,960 13,725 12,209 14,898 17,166 18,104 0 2,000 4,000 6,000 8,000 10,000 12,000 14,000 16,000 18,000 20,000 Sep-14 QTR Ended Dec-14 QTR Ended Mar-15 QTR Ended Jun-15 QTR Ended Sep-15 QTR Ended Dec-15 QTR Ended Mar-16 QTR Ended Jun-16 QTR Ended Sep-16 QTR Ended Dec-16 QTR Ended Mar-17 QTR Ended Jun-17 QTR Ended Sep-17 QTR Ended Dec-17 QTR Ended Total Dispensed Prescriptions Alevicyn Celacyn Mondoxyne Ceramax Sebuderm Loyon Total Source: IMS Health NPA Average Quarter over Quarter Growth for Last 8 Quarters of 14% - December Quarter up 5% over September Quarter - September Quarter up 15% over June Quarter - June Quarter up 22% over March Quarter
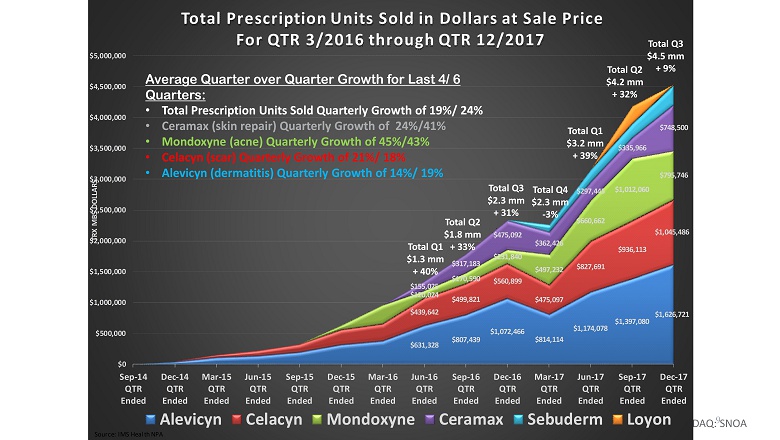
NASDAQ: SNOA Total Q4 $2,552,720 + 7% Total Q3 $2,393,001 + 15% Total Q4 $2,791,258 + 17% Total Q2 $2,088,619 + 26% Total Q4 $2,791,258 + 17% 9 Average Quarter over Quarter Growth for Last 4/ 6 Quarters: • Total Prescription Units Sold Quarterly Growth of 19%/ 24% • Ceramax (skin repair) Quarterly Growth of 24%/41% • Mondoxyne (acne) Quarterly Growth of 45%/43% • Celacyn (scar) Quarterly Growth of 21%/ 18% • Alevicyn (dermatitis) Quarterly Growth of 14%/ 19% Total Q3 $4,542,947 + 9% Total Q3 $2,344,857 + 31% $631,328 $807,439 $1,072,466 $814,114 $1,174,078 $1,397,080 $1,626,721 $439,642 $499,821 $560,899 $475,097 $827,691 $936,113 $1,045,486 $120,024 $170,590 $231,840 $497,232 $660,662 $1,012,060 $795,746 $155,025 $317,183 $475,092 $362,426 $297,445 $335,966 $748,500 $0 $500,000 $1,000,000 $1,500,000 $2,000,000 $2,500,000 $3,000,000 $3,500,000 $4,000,000 $4,500,000 $5,000,000 Sep-14 QTR Ended Dec-14 QTR Ended Mar-15 QTR Ended Jun-15 QTR Ended Sep-15 QTR Ended Dec-15 QTR Ended Mar-16 QTR Ended Jun-16 QTR Ended Sep-16 QTR Ended Dec-16 QTR Ended Mar-17 QTR Ended Jun-17 QTR Ended Sep-17 QTR Ended Dec-17 QTR Ended TRX MBS DOLLARS Total Prescription Units Sold in Dollars at Sale Price For QTR 3/2016 through QTR 12/2017 Alevicyn Celacyn Mondoxyne Ceramax Sebuderm Loyon Source: IMS Health NPA Average Quarter over Quarter Growth for Last 4/ 6 Quarters: • Total Prescription Units Sold Quarterly Growth of 19%/ 24% • Ceramax (skin repair) Quarterly Growth of 24%/41% • Mondoxyne (acne) Quarterly Growth of 45%/43% • Celacyn (scar) Quarterly Growth of 21%/ 18% • Alevicyn (dermatitis) Quarterly Growth of 14%/ 19% Total Q1 $1.3 mm + 40% Total Q2 $1.8 mm + 33% Total Q3 $2.3 mm + 31% Total Q4 $2.3 mm - 3% Total Q1 $3.2 mm + 39% Total Q2 $4.2 mm + 32% Total Q3 $4.5 mm + 9%